Common Evaluation Metrics in CV
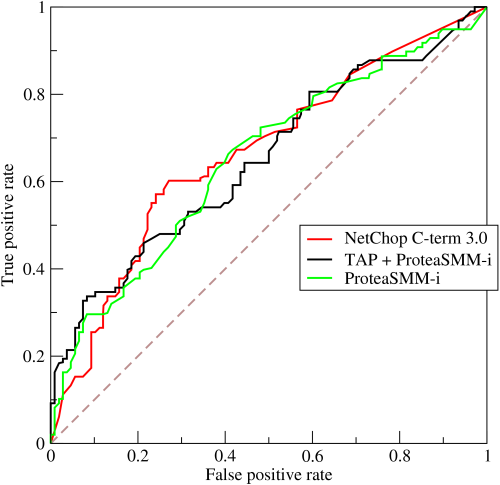
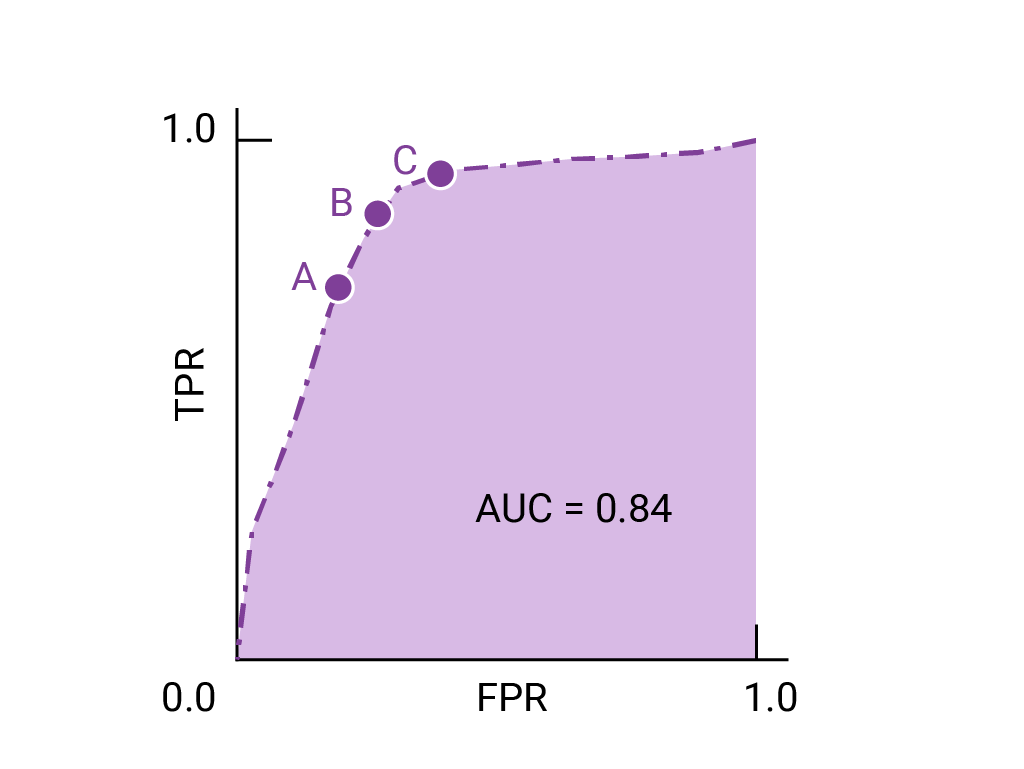
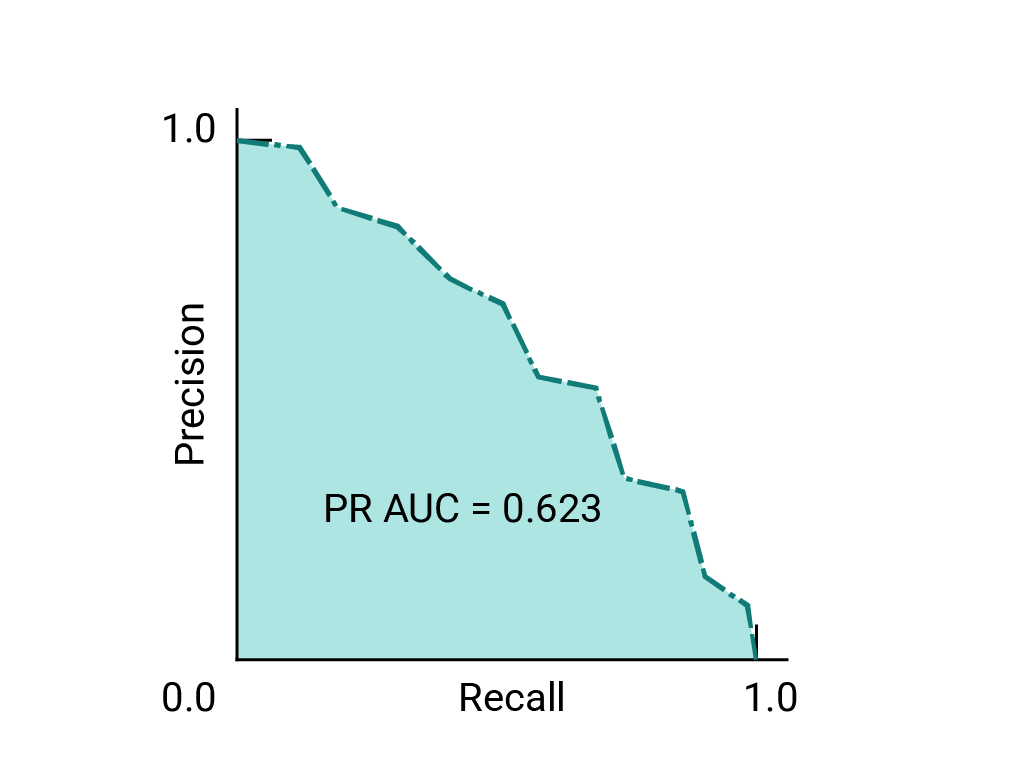
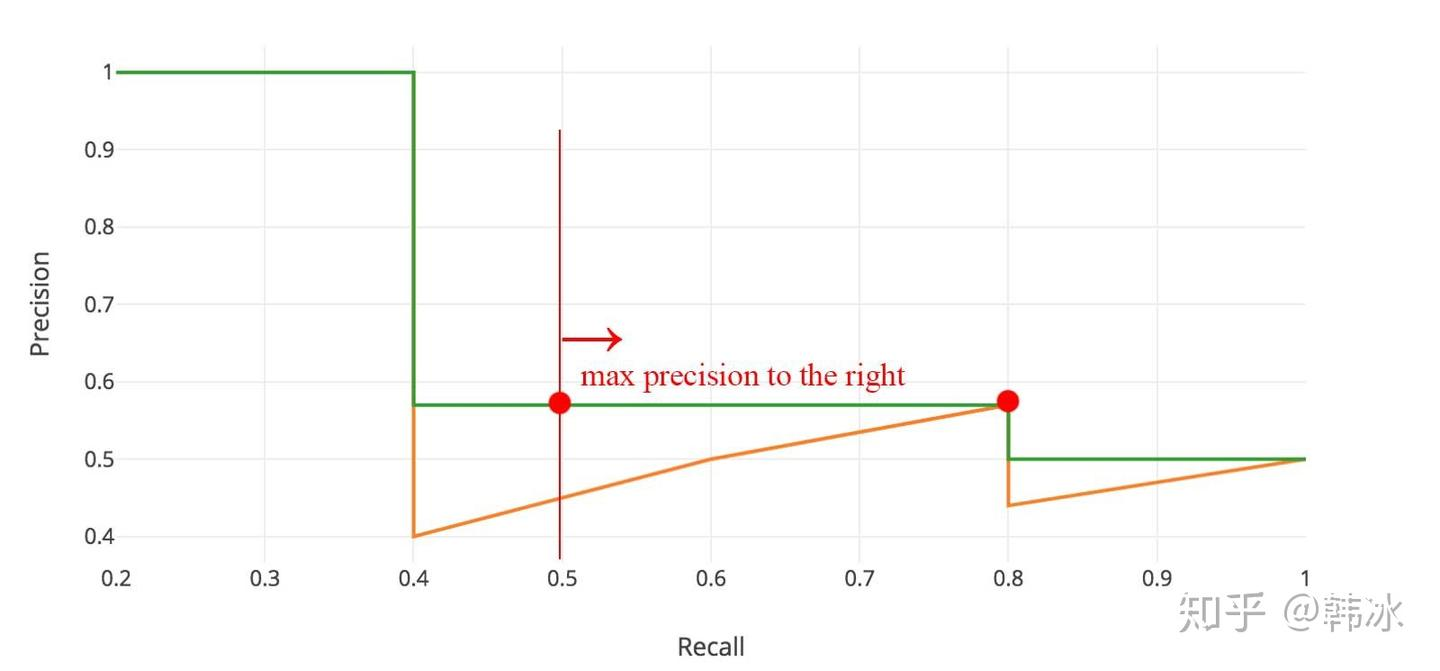
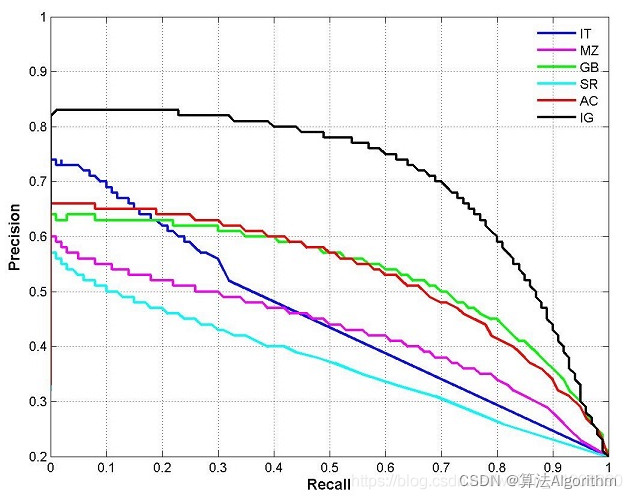
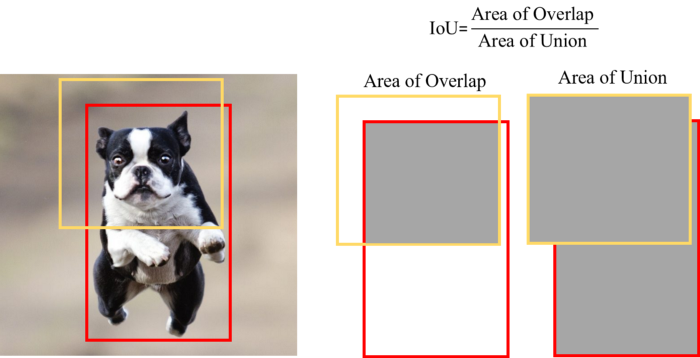
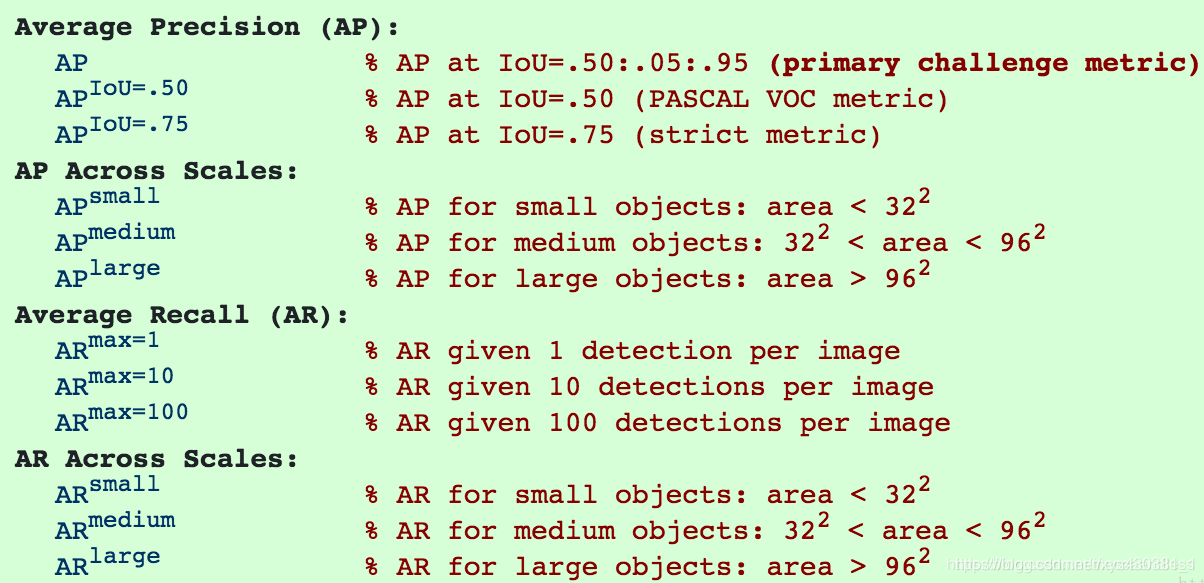
Common Evaluation Metrics in CV type: Post status: Published date: 2025/09/16 Classification tasks identify which class an input image belongs to. Common metrics include: Accuracy $$ Accuracy = \frac{TP + TN}{TP + TN + FP + FN} $$ The proportion of correctly predicted samples among all samples. Suitable when class distribution is balanced. Precision $$ Precision = \frac{TP}{TP + FP} $$ Among all predictions labeled as positive, the proportion that are truly positive. Focuses on the correctness of positive predictions. The main idea: negatives should not be predicted as positives. When the cost of false positives is high, we want to avoid misclassification. For example, in spam filtering, the cost of missing spam is much lower than putting legitimate emails into the spam folder. $$ Recall = \frac{TP}{TP + FN} $$ Among all true positives, the proportion successfully retrieved. Focuses on completeness. The main idea: positives should not be predicted as negatives. For example, in disease screening, misdiagnosing a positive as negative may miss timely treatment. $$ F1 = 2 \cdot \frac{Precision \cdot Recall}{Precision + Recall} $$ Used when balancing precision and recall. ROC Curve & AUC The ROC curve shows TPR vs. FPR across thresholds. AUC is the area under the curve and measures overall separability. PR Curve If classes are roughly balanced, ROC and AUC are suitable for model comparison. When data are imbalanced, the Precision-Recall curve (PRC) and area under it better visualize performance. AP is based on the Precision-Recall curve by averaging precision over recall values; it is the area under the curve. In practice, the right-side maximum is often used. In multi-class object detection, each class has its PR/AP curve; mAP is the mean of APs across classes. Object detection predicts both location (bounding boxes) and class. IoU (Intersection over Union) $$ IoU = \frac{\text{Predicted box} \cap \text{Ground-truth box}}{\text{Predicted box} \cup \text{Ground-truth box}} $$ Measures the overlap between predicted and ground-truth boxes. Typically IoU ≥ 0.5 counts as a correct detection. mAP (mean Average Precision) If the IoU threshold = 0.5, it is AP@50 (prediction counts as correct if overlap ≥ 50%). If IoU threshold = 0.75, it is AP@75, and so on. In COCO, AP[.50:.05:.95] means AP is computed at IoU thresholds from 0.50 to 0.95 in steps of 0.05 (10 values) and then averaged. Therefore, common comparisons include: FPS (Frames per Second) Measures inference speed; used to balance accuracy and real-time performance. Segmentation performs per-pixel classification. Pixel Accuracy Correctly classified pixels / Total pixels. IoU (Jaccard Index) Measures overlap between predicted and ground-truth regions. Used in semantic and instance segmentation. mIoU (mean IoU) IoU averaged over all classes; the most common segmentation metric. Dice Coefficient (F1 for segmentation) $$ Dice = \frac{2 \cdot |\text{Prediction} \cap \text{Ground truth}|}{|\text{Prediction}| + |\text{Ground truth}|} $$ More sensitive to small targets; common in medical image segmentation. Used in image retrieval, face recognition, etc., where results are ranked. Top-k Accuracy Correct if the true label appears in the top k predictions (common in ImageNet). Recall@k Whether the target appears in the top k retrieved results. mAP@k Average Precision computed over the top k results. NDCG (Normalized Discounted Cumulative Gain) Measures how close the ranking is to the ideal ordering. In one-stage detectors (e.g., RetinaNet), two prominent issues: Focal Loss adds a modulating factor on top of cross-entropy to down-weight easy examples and focus on hard ones. $$ FL(p_t) = -\alpha (1 - p_t)^\gamma \log(p_t) $$ Explanation of the focusing parameter: Thus, $\gamma$ controls the focus on hard samples. In practice: https://zhuanlan.zhihu.com/p/479674794 https://zhuanlan.zhihu.com/p/88896868 https://blog.csdn.net/qq_42722197/article/details/128963093 https://hackmd.io/@wayne0509/HkZ6rEZMP#mAP https://developers.google.com/machine-learning/crash-course/classification/accuracy-precision-recall?hl=zh-cn https://developers.google.com/machine-learning/crash-course/classification/roc-and-auc?hl=zh-cn Lin, T. Y., Goyal, P., Girshick, R., He, K., & Dollár, P. (2017). Focal loss for dense object detection. In Proceedings of the IEEE International Conference on Computer Vision (pp. 2980-2988). https://amaarora.github.io/posts/2020-06-29-FocalLoss.htmlCV Object Detection Metrics
1. Common Evaluation Metrics
2. Common Metrics for Object Detection

3. Common Metrics for Image Segmentation
4. Common Metrics for Retrieval and Ranking
5. Additional Metrics
Focal Loss
References: